
In this article, I’m going to walk you through how I use the Chrome DevTools Console to extract and analyze key metadata elements—namely the page title, meta description, and meta robots tag. This is the first part of a series where I’ll show you different ways to leverage Chrome DevTools for technical SEO audits. Instead of relying on extensions, we’ll use JavaScript snippets in the Console. It’s especially helpful when you’re working in incognito mode, or just need a quick check without installing any additional tools.
Accessing & Clearing the Console
To open the DevTools Console in Chrome, I press Ctrl+Shift+J on Windows or Cmd+Option+J on macOS. Sometimes, DevTools opens to the Elements panel by default, so I click on “Console” to switch tabs. If I need a clean slate, I use console.clear() right in the Console or press Ctrl+L (Windows) or Cmd+K (macOS). That way, my previous logs and results won’t clutter my new audit.

Title & Meta Description Analysis
One of the first things I like to check is the page’s title and meta description. They’re essential for how a page appears in search results. A quick snippet will grab both elements from the DOM and print them in the Console. I also include a character count for the meta description to see if it’s within common SEO guidelines (roughly 50–60 characters for titles, 150–160 for descriptions).
// Title & Meta Description Analysis
// The following code retrieves and displays the page title and meta description with improved formatting

// Define styles for a cleaner and more visually appealing console output
const sectionStyle = "color: white; background: #007acc; font-size: 14px; font-weight: bold; padding: 6px; border-radius: 4px;";
const labelStyle = "color: #0b5d1e; font-weight: bold;";
const valueStyle = "color: #222;";

// Display the section title
console.log("%c Title & Meta Description Analysis ", sectionStyle);

// Retrieve and display the Page Title
console.log(`%cPage Title: %c${document.title}`, labelStyle, valueStyle);

// Retrieve and display the Meta Description
let metaDescription = document.querySelector('meta[name="description"]');
if (metaDescription) {
  console.log(`%cMeta Description: %c${metaDescription.content}`, labelStyle, valueStyle);
  console.log(`%cDescription Length: %c${metaDescription.content.length} characters`, labelStyle, valueStyle);
} else {
  console.log("%cNo meta description found", "color: red; font-weight: bold;");
}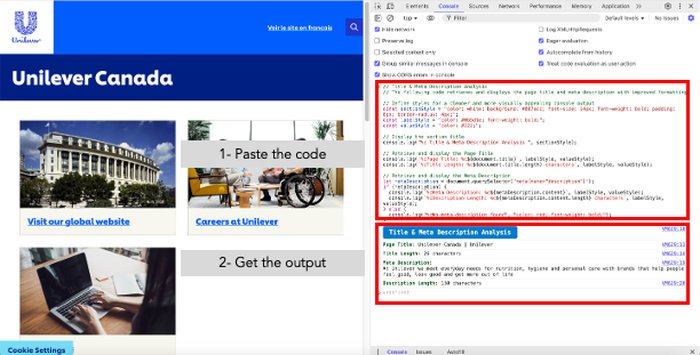
By running this snippet, I get instant feedback on whether the current title is descriptive enough and if the meta description is likely to display fully on SERPs.
Meta Robots Tag Detection
I also check the meta robots tag to confirm how search engines are instructed to crawl or index a page. If it’s missing, I need to decide whether to add one or see if the site is relying on other directives (like x-robots-tag headers). Here’s a short snippet that looks specifically for meta[name=”robots”].
// Meta Robots Tag Analysis
// This code targets a meta tag with 'robots' as the name and reports its content

// Define styles for a cleaner and more visually appealing console output
const sectionStyle = "color: white; background: #007acc; font-size: 14px; font-weight: bold; padding: 6px; border-radius: 4px;";
const labelStyle = "color: #0b5d1e; font-weight: bold;";
const valueStyle = "color: #222;";

// Display the section title
console.log("%c Meta Robots Tag Analysis ", sectionStyle);

// Retrieve and display the Meta Robots tag
let metaRobots = document.querySelector('meta[name="robots"]');
if (metaRobots) {
  console.log(`%cMeta Robots Tag: %c${metaRobots.content}`, labelStyle, valueStyle);
} else {
  console.log("%cNo Meta Robots tag found", "color: red; font-weight: bold;");
}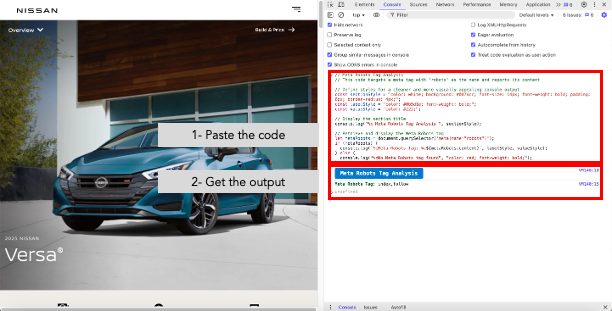
If the tag is missing, I often investigate further to ensure nothing else is instructing the page to be noindexed or nofollowed. It’s a simple check, but it can save a lot of headaches down the road.
Canonical & Hreflang Tags
Canonical tags and hreflang attributes are another must-check for me, especially if I’m working on international sites or worried about duplicate content issues. The canonical tag points search engines to the preferred version of a page, while hreflang tells them which language and region a page targets.
Here’s the snippet I rely on for these checks. It distinguishes between self-referencing canonicals and those that point elsewhere, and it also gathers all hreflang link elements.
// Canonical & Hreflang Analysis
// This code checks for a canonical link and any hreflang attributes, then logs them with styling

// Define styles for a cleaner and more visually appealing console output
const sectionStyle = "color: white; background: #007acc; font-size: 14px; font-weight: bold; padding: 6px; border-radius: 4px;";
const labelStyle = "color: #0b5d1e; font-weight: bold;";
const valueStyle = "color: #222;";

// Display the section title
console.log("%c Canonical & Hreflang Analysis ", sectionStyle);

// Check for canonical tag
const canonicalTag = document.querySelector('link[rel="canonical"]');
if (canonicalTag) {
  const canonicalHref = canonicalTag.href;
  console.log(`%cCanonical URL: %c${canonicalHref}`, labelStyle, valueStyle);

  if (canonicalHref === window.location.href) {
    console.log("%cThe canonical is self-referencing.", labelStyle);
  } else {
    console.log("%cThe canonical points to a different URL.", "color: orange; font-weight: bold;");
  }
} else {
  console.log("%cNo canonical tag found", "color: red; font-weight: bold;");
}

// Check for hreflang tags and display in a table
const hreflangTags = document.querySelectorAll('link[rel="alternate"][hreflang]');
if (hreflangTags.length > 0) {
  console.log(`%cFound ${hreflangTags.length} hreflang tag(s):`, labelStyle);

  let hreflangData = [];
  hreflangTags.forEach(tag => {
    hreflangData.push({
      "Hreflang": tag.getAttribute("hreflang"),
      "URL": tag.href
    });
  });

  console.table(hreflangData);
} else {
  console.log("%cNo hreflang tags found", "color: red; font-weight: bold;");
}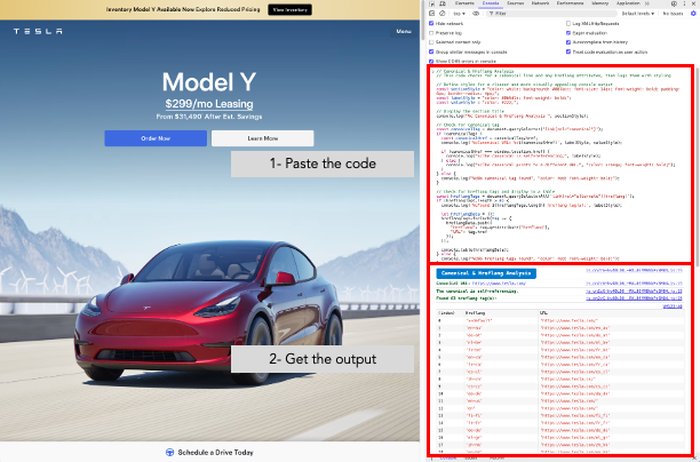
This is especially important on large international websites, where incorrect or conflicting hreflang attributes can misdirect traffic or lead to indexing headaches. By running these checks directly in the Console, I can quickly see if the site has a self-referencing canonical and whether each hreflang attribute matches the correct URL.
Open Graph & Twitter Card Checks
Whenever I’m optimizing pages for social sharing, I need to confirm whether Open Graph and Twitter Card tags are set correctly. This helps ensure that shared content looks professional and relevant, complete with the right titles, descriptions, and images.
Here’s the code snippet I use. It scans for both Open Graph tags—like og:title, og:description, and og:image—and Twitter Card tags that start with twitter:. I’ve included some console styling as well, so the output is clearer to read.
// Open Graph & Twitter Card Analysis
// This code looks for meta tags starting with og: or twitter:, then logs them in a formatted way

// Define styles for a cleaner and more visually appealing console output
const sectionStyle = "color: white; background: #007acc; font-size: 14px; font-weight: bold; padding: 6px; border-radius: 4px;";
const labelStyle = "color: #0b5d1e; font-weight: bold;";
const valueStyle = "color: #222;";
const separatorStyle = "color: gray; font-size: 12px;";

// Display the section title
console.log("%c Open Graph & Twitter Card Analysis ", sectionStyle);

// Open Graph Analysis
console.log("%c Open Graph Meta Tags ", sectionStyle);
const ogTags = document.querySelectorAll('meta[property^="og:"]');
if (ogTags.length > 0) {
  console.log(`%cFound ${ogTags.length} Open Graph tag(s):`, labelStyle);

  ogTags.forEach(tag => {
    const property = tag.getAttribute("property");
    const content = tag.getAttribute("content");
    console.log(`%c${property}:\n%c${content}`, labelStyle, valueStyle);
    console.log("%c────────────────────────────────────", separatorStyle);
  });
} else {
  console.log("%cNo Open Graph tags found", "color: red; font-weight: bold;");
}

// Twitter Card Analysis
console.log("%c Twitter Card Meta Tags ", sectionStyle);
const twitterTags = document.querySelectorAll('meta[name^="twitter:"]');
if (twitterTags.length > 0) {
  console.log(`%cFound ${twitterTags.length} Twitter Card tag(s):`, labelStyle);

  twitterTags.forEach(tag => {
    const name = tag.getAttribute("name");
    const content = tag.getAttribute("content");
    console.log(`%c${name}:\n%c${content}`, labelStyle, valueStyle);
    console.log("%c────────────────────────────────────", separatorStyle);
  });
} else {
  console.log("%cNo Twitter Card tags found", "color: red; font-weight: bold;");
}
When you run this code in the Console, you’ll see each tag with its corresponding content. If there’s an og:image or twitter:image, you can open that URL in a new tab to confirm it’s the correct image.
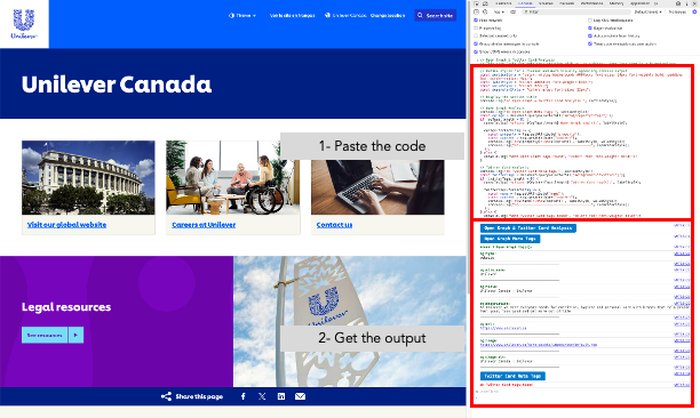
I like how this approach clearly identifies all the main social tags in one go. If the page is missing a crucial tag (like og:image), I note it and recommend adding it to improve how the page appears when shared on social platforms.
Conclusion: Why Console Methods Outshine Extensions
There are plenty of SEO extensions out there, but relying on JavaScript snippets in the Console can often be a smarter choice. Here’s why:
- Works in Incognito Mode: Extensions typically don’t run in private browsing. Using the Console gives you a reliable way to audit pages without leaving incognito.
- No Installation Hassles: On a client’s machine or a shared environment, you might not want to install new tools. The snippets you’ve seen here are just copy-and-paste.
- Full Customization: Extensions provide set features. With these scripts, you can easily modify labels, styling, or even add new checks—no waiting for plugin updates.
- Reduced Tool Conflicts: Some extensions conflict with each other or with Chrome itself. Console-based audits have no such overhead or risk.
Ultimately, using DevTools directly helps you maintain full control over the information you gather. You’re not tethered to any third-party updates or limitations. And now that you’ve got sample snippets with color-coded output, you can adapt them as needed without fumbling through multiple browser tools.
In upcoming articles, I’ll share more ways to harness Chrome and JavaScript for deeper site audits—covering everything from performance insights to structured data checks. Stay tuned, and follow me on LinkedIn, YouTube, or X for more tips. You can also visit my personal website for the latest articles in this series.