
As an SEO, one of my most common frustrations with Google Search Console was being limited to a daily data view. Analyzing broader trends felt clunky, as the day-to-day fluctuations can be noisy and misleading. While exporting data to tools like Looker Studio is an option, it’s not a quick solution for a simple change in perspective.
Because I needed this functionality in my own workflow, I developed a simple solution: the Advanced GSC Visualizer Chrome extension. It allows you to see your performance data in weekly or monthly views directly within the GSC interface. In this post, I’ll walk you through how it works.
The Problem: Google Search Console’s Daily Data Limitation
The daily view in GSC is great for spotting sudden changes, but it’s not ideal for strategic analysis. Weekly and monthly views help you:
- Identify consistent upward or downward trends without daily fluctuations.
- Analyze performance month-over-month or week-over-week.
- Report on progress to clients or stakeholders in a clearer, more digestible format.
How to See Weekly & Monthly GSC Data in 3 Simple Steps
Here’s how you can get this enhanced view up and running in under two minutes.
Step 1: Install Advanced GSC Visualizer Chrome Extension
First, you need to add the “Advanced GSC Visualizer” to your Chrome browser. It’s available on the official Chrome Web Store.
Install it from this link: Advanced GSC Visualizer on Chrome Web Store
Step 2: Activate the Extension and Refresh GSC Performance Page
Once the extension is installed and activated, navigate to your Google Search Console property. If you’re already on the page, simply give it a hard refresh (Ctrl+R or Cmd+R). You will now see a new button.
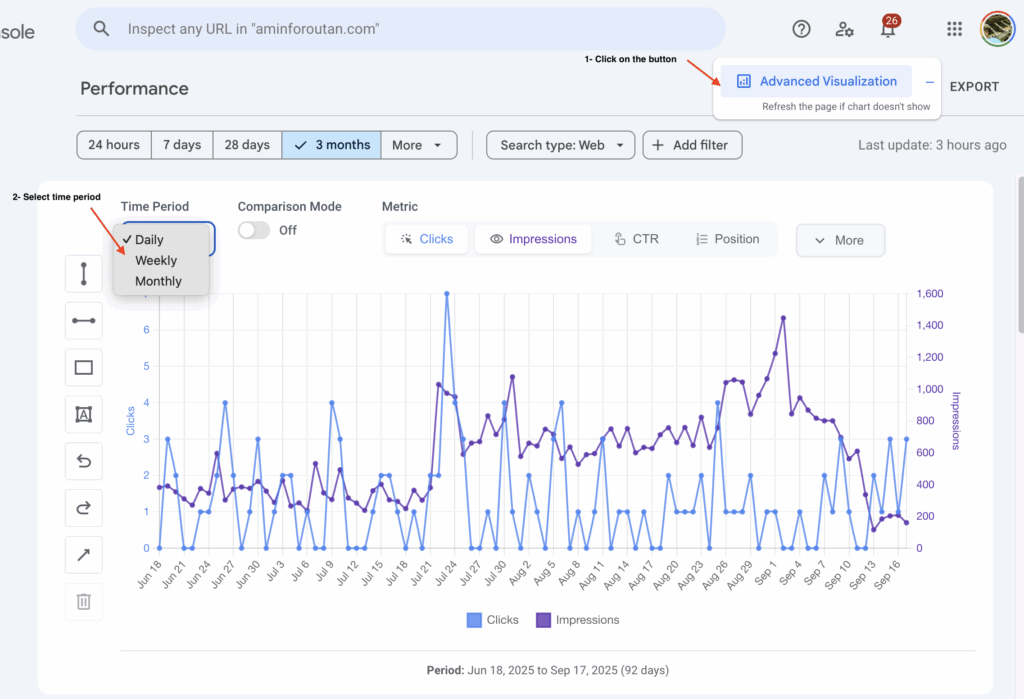
Go to the Performance report, and then click on the new “Advanced Visualization” button.
Step 3: Select Your Timeframe
Clicking that button will open a new, more powerful chart. To change the timeframe, simply click on the time period dropdown menu. Here, you can select whether you want to view the data in daily, weekly, or monthly mode.
That’s it! The chart will instantly update to show your clicks, impressions, CTR, and position data aggregated by the week or month.
Bonus Features: More Ways to Visualize and Export Your Data
This extension has some other great features that you’ll love, and I will discuss them in future posts. But for a quick preview, if you click on the “More” button, new options will appear.
By clicking on “Chart Types,” you can instantly switch between a line chart, bar chart, or area chart to view your data in the way that makes the most sense for your analysis. You can also export the data of each view by clicking on the “Export Data” button. This will give you a CSV file with the weekly or monthly performance data you are currently viewing.

A Must-Have SEO Tool You Can Trust
The Advanced GSC Visualizer is a safe, secure, and regularly updated tool that enhances your workflow without ever leaving Google Search Console. It’s trusted by a large community, with more than 13,000 users, and has been mentioned by reputable sources like Search Engine Land as a must-have tool for SEO professionals.
Stop spending time exporting data just to see a simple weekly trend. Download the extension and get the insights you need, faster.